Loading....

Advanced Entity Management

Entity Management from RightITnow

Streamlining Your Entity Topology with Advanced IT Operations Entity Management

Merging Entities to Reduce Redundancy in Your Entity Grid

You can merge multiple entities into one selected entity to reduce redundancy in your entity grid. When ECM merges entities, it deletes all merged entities except the designate entity, adds the names and aliases of merged entities as aliases of the designate entity, adds the IP and MAC addresses of the merged entities to those of the designate entity, assigns the designate entity to the selected owner (if any), assigns the designate entity to the selected groups (if any), adds the maintenance windows of the merged entities to those of the designate entity, associates the alerts of the merged entities are now associated with the designate entity, and assigns child entities of the merged entities as children of the designate entity.

Configuring Entity Classes and Types

You can configure entity classes and types to be displayed and assigned to entities in the Entity console. For example, you may wish to have a class named, “virtual,” and a type named, “VMware,” that you can assign to entities to help you manage and classify them. ECM allows you to classify your entities however makes the most sense to your organization and builds these customizations into the product in various places for use by your operators.

Editing the Entity and Entity Group Hierarchy

You can select entities in the entity grid and set them as the children of another entity, and you can also add entity groups to other entity groups, and remove entity groups from entity groups. When editing the entity hierarchy, you must select non-polled entities to add to a parent entity, for example, entities not imported from Zenoss, SolarWinds, or VMware. You can also select several sibling child entities (non-polled) and remove them from their parent entity (undo the hierarchy) by choosing Remove from parent entity from the context menu.

Insight into Your Entities

The entity network map is a very useful tool for visualizing your entity topology, and it also displays the entity hierarchy within an entity group. This is all presented in a familiar and effective hierarchical tree view. Each entity has built-in fields associated with it, and you can create custom entity fields and these fields, built-in and custom, are available to you in the RSS feed template, so when you access an RSS feed created by you in ECM, that feed will report on your built-in and custom entity fields.

IT Operations Rest API

Customizing and Performing IT Operations Management with a Rich and Powerful REST API

Retrieving Events and Alerts with the ECM REST API

The REST API is designed to integrate ECM with your IT applications .You can use the ECM REST API to get alerts by a filter and by alert ID. You can also get all filters and all breached SLAs for a user, allowing you to program into your application all of the power of the ECM Alerts Console. You can even Retrieve the list of events that have occurred between a specified time interval.

Acting on Alerts with the ECM REST API

You can use the ECM REST API to change alert priority, alert severity and alert ownership. You can also unassign, acknowledge, annotate, invoke an action on, and close alerts. A related ECM REST API call can create incidents for specified alerts.

Manage Maintenance Windows Using the ECM REST API

You can use the ECM REST API to perform the following tasks related to maintenance windows: fetch all maintenance windows for entities, fetch all maintenance windows for entity groups, fetch maintenance window set for an entity, fetch maintenance window set for an entity group, set maintenance window on an entity, remove maintenance window set on entity, set maintenance window on an entity group, and remove maintenance window from group.

Manage Entities Using the ECM REST API

The ECM REST API offers full entity management. You can use the API to Fetch all Entity Groups, Fetch Entities for a Group, Fetch Entities owned by user, Fetch Entities by filter, Get Entity Hierarchy (by ID), Get Entity Hierarchy by Name, Get Entity Hierarchy by Group, Add Entities By Name to Group, Add Entities By ID to Group, Remove Entities By ID from Group, Remove Entities By Name from Group, Get Entity Group Hierarchy (by ID), Get Entity Group Hierarchy (by Name), Add Entity Group to Parent Group (By ID), Add, Entity Group to Parent Group (By Name), Remove Entity Group from Parent Group (By ID), Remove Entity Group from Parent Group (By Name), Rename Entity, Create Entity Group Type, Update Entity Custom Fields, and Retrieve Entities for given Custom Fields.

Entity Owners and Maintenance Windows

Streamlining IT Operations Management with Entity Owners and Maintenance Windows

Enrich Entities with Owners to Automatically Assign Associated Alerts

You can assign owners to entities. RightITnow ECM will assign any new alerts originating from this entity to the entity owner, eliminating the need to assign these alerts manually. For example, if you have an email guru in your organization, then you can assign this guru ownership of all of your email related entities so that anytime there is an email issue in your IT Ops environment, your guru would automatically be assigned to address those issues. This is super efficient and a huge timesaver.

Automatically Create Maintenance Windows

You can use the Create Maintenance Window action in correlation rules to automatically create a maintenance window of the specified length in hours for an alert’s entity or for the entity group of the alert’s entity. This way, you can automatically put an entity into maintenance when ECM encounters alert conditions you specify. For example, if an ECM encounters an alert with a disk full message, then you can configure ECM to automatically place all such associated entities into maintenance, and if you also assigned an owner to those entities as described in the previous section, then the owner would automatically be assigned these alerts.

Deep Maintenance Window Features to Enhance IT Ops Management

RightITnow ECM offers deep maintenance window features. You can use an action to create maintenance windows automatically as described in the previous section, or you can create them manually. You can push ECM maintenance windows to Zenoss Device Groups. When you create a maintenance window for an entity group imported from Zenoss, ECM also creates the maintenance window within Zenoss. You can schedule deployment and undeployment of Close Maintenance rules. Entity groups can inherit maintenance windows for more efficient bulk processing, saving you from creating the same maintenance window recursively down the hierarchy. An entity can have multiple maintenance windows and you can also deduplicate events during maintenance windows. By default, ECM deduplicates events received from an entity that is in maintenance only against alerts that are in maintenance. If the event would deduplicate against an alert that is not in maintenance and there are no alerts in maintenance, then a new alert, with different deduplication criteria, is created. However, you can configure ECM to allow events to deduplicate against alerts that are not in maintenance.

Surfacing Entity Ownership and Maintenance Windows to a Single Pane of Glass

You can add the Entity Owner entity field to the Alerts Console grid to reveal more information about the entity which triggered the alert, and the Overall Maintenance dashboard displet indicates which devices are under maintenance. This visibility, coupled with the ability to assign ownership and create maintenance windows for entities helps keep you on top of your entity topology and underlying issues. See http://www.rightitnow.com/operations-management/configurable-it-operations-alert-menu for more about the Alerts Console and http://www.rightitnow.com/operations-management/it-operations-management-dashboards for dashboard information.

Tagging Alerts

Giving Your Alerts Useful Nicknames at Birth

When RightITnow ECM encounters a new IT Ops event, it applies a series of rules to it that helps you deal with it in the most efficient way possible. These rules may deduplicate the event or create an new alert based on the event. One of the rule types is a tag rule that you can use to tag the event and corresponding alert with nicknames (keywords) that you can use to analyze alerts data without changing your data model or topology.

What IT Ops Tag Rules Do

A tag rule updates the Tags column in the Alerts table to the value specified in the rule. When building a tag rule, you name and describe the rule, choose the connector and build conditions like you do for any other type of rule, but you can also select multiple tags to add or remove should the conditions of the rule be met. For example, For example, you could write a rule that if the event message contains the word, “postfix” or “sendmail,” then set the Tags column value to “email:”

Tag Rules from RightITnow
This way, operators can search the Tag column for email issues more easily.

Special Tagging Features to Enhance Business Service Management

You can add a new action, Evaluate Tag Rules, to the Alert Console Context menu so that you can re-evaluate tag rules on alerts directly from the Alert Console Context menu. This allows you to re-tag the alert should another process have touch and changed the alert. You can also add or remove multiple tags at once. When executing the tag rules on incoming alerts, if the rule removes tags, it will only remove tags that were added via the event token “tag” or by another tag rule. This is executed before the alert is stored in the database, so tags that are already in the database (previously added) will not be removed.

Enhanced IT Ops Business Service Management Sans Database and Topology Changes

Tags allow you to analyze and manipulate your IT Ops alert data without changing your data model or topology, which are much more disruptive and costly changes. For example, given the correct corresponding tag rules, you could use the Tags column to quickly find all “Disk Full” or “Server Down” conditions in “Boston” without touching your database or re-arranging your entity topology. This enables you Operators to concentrate on resolving the issues rather than mining the data for the issues.

High Volume Event Processing

Setting Up Your Environment to Process High Event Volumes

First things first! A carefully planned IT Ops environment is the foundation of handling high event volumes. RightITnow ECM makes it easy to configure display settings, connectors, and users. ECM also empowers you to easily create entity groups that group entities into groups for more efficient maintenance, monitoring, and flexible reporting. Lastly for setting up your environment, create actions you can automatically trigger when RightITnow ECM encounters conditions set by you. This is a way to resolve issues before they make their way to the help desk. You may also add actions to the Alert Context menu that is available to you when you right-click an alert on the Alerts tab.

Deduplicate Events to Reduce Alerts You Need to Address

You can use ECM to create categorization rules that determine if an incoming event should be de-duplicated into an existing alert or if it should become a new alert. This greatly reduces the high event volume into something much more manageable. Instead of several hundred alerts all indicating that you have a full disk on your mail server, you just need one, with all others deduplicated into it.

Take Automatic, Resolving Action with Correlation Rules

ECM’s Correlations tab helps you create rules that trigger actions when RightITnow ECM encounters conditions set by you. For example, RightITnow ECM may request a new polling event via a linked monitoring system in order to check on the status of a device that has been inactive for some period of time. Based on the results, it can decide to raise or lower the priority of the alert, email a supervisor or escalate the alert to the Service Desk as an incident for deeper troubleshooting. Removal of open alerts when a problem solution pair is encountered is another example of IT operations process automation.

Use the Alerts Console and Dashboards to Understand Your High Volume Alert Data

ECM offers the Alerts Console as a single pane of glass to see all your alerts pouring in from internal and external systems. This gives you a great look at what your facing and also enables you to take actions on these alerts. Additionally, ECM offers many powerful, customizable dashboards that slice, dice and analyze your high volume alerts data in the most efficient way for you. See http://www.rightitnow.com/operations-management/it-operations-management-dashboards/ for more on our powerful dashboards.
SLA Processing

SLA Breach from RightITnow

Automated SLA Processing Begins with Detailed Information

RightITnow ECM now stores detailed user information, including the user work hours and time zone. User or user group work hours are accessible while defining conditions on both Correlation and SLA rules. All alerts timestamps are now stored in the local time zone that the server is deployed in and are converted back to the user specific time zone for the UI display because in many cases, users are spread across the globe and hence work in different time zones. Lastly, an availability indicator appears next to available assignees when assigning alerts via the Alerts console.

Customizable SLA Rules and Scheduling to Match Customer Needs

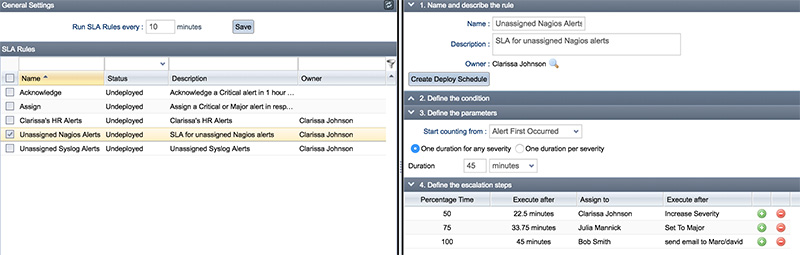
ECM provides a robust SLA rule engine that allows for highly customizable SLA rules and corresponding escalation steps. Critical alerts coming off your Payroll server can be processed immediately, assigned to your Application team while informing the key constituents Via SMS or email. If the situation was to stagnate, you can automatically upgrade the priority and reassign these alerts to a SWAT IT team while informing a wider set of managers.

SLA Rules that Take Decisive Action

You can create SLA rules that take resolving actions on offending alerts. For example, you can now use the Merge Alerts action as part of SLA rules to merge alerts into logical units you can address all at once. You can also create SLA rules that assign alerts to user groups to get many minds addressing the SLA breach at once. Once ECM makes the assignment, the Assigned Group field persists across the Actions, Correlations, Alert Console, Export/Reports, and SLA modules, allowing you to apply the concept of user groups to actions, correlations, alert manipulation, reports and SLA rules.

Knowledge and Maintenance of Your SLA Data is Key

You can use the Reports utility to generate scheduled reports on SLA breached alerts, greatly expanding on the information available in the SLA Breach Log. And to manage legacy SLA data, the Purge Utility can purge event records for alerts and SLA breaches in addition to closed alerts and audit records. Additionally, you can configure a stale alert warning for when SLA rules perform actions on alerts that have changed before the user refreshes the alerts console.

IT Operations Management Dashboards

Multiple IT Operations Management Dashboards on a Single Pane of Glass

ECM’s Dashboard tab provides you with a visual depiction of your IT Operations Management world. At a single glance, you can get a visual representation of the most recent alerts, historical trends, maintenance windows, system health, alert distribution, event processing distribution, event processing historical trends, correlations historical trends, and alert priority. You can even add a window that displays a useful website on the dashboard.

Add, Subtract and Rearrange Management Dashboards to Your Needs

Your environment is unique and you can tailor a suite of displets on the dashboard that make sense for you. You are not locked in to displaying all the dashboard displets. You pick and choose what you want. You may not need a web page displet, so, just delete it. You may have some new admins on board, so, display the Getting Started displet to shepherd them on their way to effective ECM usage.

Configure Management Dashboards to Your Needs

Each management dashboard displet offers an Edit feature that you use to tailor each displet to your specific needs. For example, in the System Health displet, you can configure the displet to display alerts against entity groups, services, or users. You can also specify which alert states to display and how to sort the data, and the refresh rate. Display several views of your data center side to side by selecting user-defined filters.

Create Multiple Management Dashboard and Link Them

You can create multiple dashboards and keep them to yourself, or share them with specific groups. You can save a dashboard configuration and link it to the current dashboard, reflecting current settings, and allowing you to change the visibility, order and size of grid columns on the Alerts displet, and the sorting, freezing and grouping of the grid on the Alerts displet.. You can also set a Default Dashboard setting to create a default dashboard for all users, so that everyone is on the same single pane of glass when observing your IT Operations Management world.

Automatically Managing Alerts and Processing Events

Multiple Correlation Rule Types to Manage Alerts and Process Events

You can take actions on alerts automatically using ECM’s powerful correlation rules feature. You create the correlation rules needed by your enterprise and ECM automatically executes an action on an alert after evaluating a correlation rule as true against that alert.

First Step in Managing Alerts and Processing Events with Correlation Rules

After ECM creates an alert, it enriches the alert with the following types of correlation rules:
Maintenance rule – Sets the maintenance field to TRUE if the alert’s entity is in maintenance. You can add an additional action or action group to this default behavior, for example, sending an email informing the supervisor of the maintenance period. You may also deduplicate against alerts that are not maintenance.

Close Maintenance rule – Dynamically closes a maintenance window based on a condition from an incoming alert.
Tag rules – Sets the Tags column in the Alerts table to the value specified in the rule. For example, if the message contains the word, “postfix” or “sendmail,” then set the Tags column value to “email:”

Second Step in Managing Alerts and Processing Events

After applying the enrichment rules, ECM executes the next wave of correlation rules against the alert:
Upon Event Arrival – Rules that trigger actions based upon the alert attributes, for example, if the entity has an owner, set the owner of the alert to be the same as the entity. These rules are evaluated upon arrival of the alert or modification of the alert’s event count.

Periodic Rules – Rules that execute actions on a periodic basis based upon the alert attributes, for example, a rule that sets the alert severity to Clear when the severity is Info.

Problem Resolution Rules – Rules created in the Alerts table by identifying one alert as a problem and another alert as the solution to that problem.

Timed Conditions (X in Y) – Rules that trigger actions if an alert occurs X number of times over a Y period. If you only want to act if an alert has occurred X times without restrictions over the period, you can use a correlation rule (upon creation) and use the eventcount field in the conditions section.

Managing Alerts and Processing Events: You Make the Rules!

Use RightITnow ECM to take complete control of and exploit all of that information flooding in from your entire universe of entities. ECM uses maintenance, close maintenance, tag, upon event arrival, periodic, problem resolution and timed conditions correlation rules that you create and customize to manage alerts and process events with as little intervention from you as possible, freeing you from tactical fire fighting to think strategically about the direction and evolution of your IT Ops.

Configurable IT Operations Alert Menu

Handling Alerts with the Configurable Alert Context Menu

Thanks to ECM’s categorization and correlation rules, many IT Operations events are resolved before they have a chance to become an alert on ECM’s single pane of glass Alert Console. Once an alert makes it to the Alert Console, you can configure and use the Alert Context menu to act on alerts in a multitude of ways.

Out of the Box Alert Context Menu Functionality

By default, the Alert Context menu allows you to right-click an alert and change severity, change priority, assign it, close it, unacknowledge it, and more, all without leaving ECM’s single pane of glass Alert Console.

Configuring the Alert Context Menu for Third-Party Integrations

In addition to the default Alert Context menu functionality, you can configure the Alert Context menu to interact with third-party systems such as Nagios, Zenoss, and SolarWinds. For example, you could configure the Alert Context menu to offer such items as “Open in Nagios,” “Annotate Zenoss Event,” and “Update Incident ID.” This way, you can achieve bi-directional integration with your third-party applications.

Configuring the Alert Context Menu for Grouping and Tagging Alerts, and More

Aside from the default and third-party Alert Context menu functionality, you can configure the Alert Context menu to help you organize alerts into groups, or roll up lots of alerts into a single alert. You can also add and remove tags to and from alerts and even reevaluate tag rules after performing other actions on an alert. If you would like to research an alert, you can add the Google Search command so that you can perform a Google search on any alert in the Alerts Console. Another powerful feature is that you can create a maintenance window based on an alert, directly from the alert in the single pane of glass ECM Alerts Console.

Filtering High Volume ITOps Alerts Streams

Filtering to Stem the Tide of High Volume ITOps Alerts Streams

It does not take long for your ITOps environment to amass enough entities to generate a huge high-volume alerts stream, especially if you are using our built-in connectors to such products as Zenoss, Nagios and SolarWinds. ECM not only helps you manage this stream by collecting all the alerts on a single pane of glass, but it also offers filtering features that make that single pane of glass more manageable and understandable.

Simple Grid-Based ITOps Alerts Filtering and Sorting

From ECM’s single pane of glass Alerts Console, you can filter the amount of Alerts displayed by entering a value in any of the grid’s columns to filter on that value. For example, you could enter “syslog” in the Connector column to display only those alerts associated with syslog. If you are really happy with the result, you can save this configuration as a repeatable, sharable filter. Additionally, you can click on any column to sort the Alerts grid on that column.

Advanced Filtering of the ITOps Alerts Stream

When simple, grid-based filtering is not enough, you can use ECM’s Advanced Filtering pane features to quickly build complex queries intuitively, and then save them as named filters that you can load later and share with other users and user groups. For example, you can use the advanced filtering condition builder to search for all SolarWinds alerts that are of high priority and unassigned.

Saving and Sharing Powerful Filters for High-Volume ITOps Alerts Streams

Once you have created a really useful filter, you can name it and save it for reuse, and also share it across users and user groups. For example, let’s say that you have a user group, “Nagios Administrators,” then you could create a filter that displays high priority Nagios alerts and share the reusable filter with the Nagios Administrators user groups so they will have it at their ready whenever logged in.

Back To TopBack To Top