
Loading....

Best Network Monitoring Software

Every IT administrator no matter the size of the organization or network can utilize a tool such as network monitoring software. From monitoring devices on the network to analyzing the traffic flooding your network in real-time, choosing the best network monitoring software to fit your needs is crucial to the security and stability of your entire network. Let’s take a look at some of the more important and impactful features you may want to consider when conducting your research and shopping around.

Easily troubleshooting identified problems can prove to be a very effective feature that should not be overlooked when choosing software. In many software packages, you will be able to choose settings to accordingly match with your network’s protocols and applications. Whichever software you choose, make sure they can mesh successfully.

In the increasingly mobile business environment a networking monitoring software that can be accessed from your smartphone or tablet can prove to be incredibly convenient to manage and monitoring your network of applications and servers. Many of the very best network monitoring software available on the market today offers a client application to track anything from network outages, specific nodes, security alarms and other the ability to monitor other factions of your network directly from your smartphone or tablet. With many business professionals and IT managers working remotely, this is a feature many find to be valuable.

When looking for the best network monitoring software to fit your needs, one feature that is arguably the most important is the level of detail in which you have access to when analyzing traffic and other data your network will produce. Specifically, a tool that captures HTTP traffic from specific computers and their host internet can be useful in identifying incoming security threats before they hit your servers and potentially cause destruction. Much of the software available allows you to customize which traffic is analyzed and from which applications and browsers.

Overall performance monitoring of your network will prove to be crucial no matter the network monitoring software you chose. Choosing software that consistently monitors your servers, most used applications and overall communication channels of your entire business is a necessary feature and the primary reason for the software in most cases. Choosing a software that has an alert system to automatically notify you of a suspicious chain of events can be prove to highly valuable for the IT administrator always on the road or simply with just a lot on his or her plate. The ability to configure your monitoring agents and plug-ins is a crucial feature that cannot be overlooked in your search for the best network monitoring software.

As with much software in today’s tech landscape, some of the best network monitoring software is offered in free (but limited) version to test the interface and see if would be a good fit for your needs from an aesthetic and user dashboard level. Most of these free versions are only good for smaller enterprises, but can be useful none the less in making an often very important decision for your IT well-being.

Application monitoring tools

For the IT professionals in the current business landscape, monitoring and actively managing the often changing and meticulous applications used to run your business can be a headache. With that and as with many software tools in today’s tech landscape application monitoring tools can often be best utilized when fully cloud integrated, allowing the administrator to monitor all of their applications in real-time that are ran in their organization or network from anywhere they may be. Let’s take a look at some of the key functionality options and features you will want to consider when choosing the best application monitoring tool to fit you (or your company’s) needs.

Performing a tracing and root cause analysis on your list of applications is often one of the more important functions that any application monitoring tool can perform. By tracing an application, you can identify the slowest application operations and determine the exact area or application to focus your efforts to achieve optimum efficiency. Many cloud based application monitoring tools can accumulate large amounts of data and code to determine their execution timing and performance. If you are running applications that perform many high end user transactions such as credit card transactions or other user based queries that rely on customer satisfaction, you will want to find a tool that gives you high-detail information to conduct your root cause analysis. Whether it’s the utilization of your CPU dashboard or a bad line of code, the more information your application monitoring tool can provide is what you want to look for. With that said, you will also want to make sure the tool you choose supports the applications you use and the appropriate plug-ins and compatibility that fit your needs.

Another key feature you want to look for in your choice of application monitoring tool is an intuitive and easy to read dashboard that features key metrics that you will require to adequately track your litany of applications daily. Some of the most important metrics you will want to look for are number of requests detailed by time, end user response time (as touched on above), highest end user response time, page rendering and loading time and number of coding errors over a set period of time. In a transaction based business, you will want a tool that looks at the transaction piece of your business as a whole, detailing everything from the number of transactions completed, to identifying the slowest and fastest transactions.

If your company uses applications that many of its customers use on a daily basis, it’s a good idea to look for a tool that offers real user monitoring to track metrics and data from them in real-time. By tracking customer’s habits and movements within the application, you can make effective business decisions that can have a wide range of impact. With real user monitoring, you can test and track a variety of issues based on unique attributes such as location of the end user and type of web browser they are using. Depending on the size of your operation, and as with everything today, monitoring your applications via your smartphone is also a feature that many IT professionals find valuable in looking for an application monitoring tool.

Server monitoring software

As an IT professional who has witnessed severe escalations in a corporation , server monitoring software is a tool that one cannot do without. The security and stability of your server can mean the “life or death” of your work and the paralysis of mission critical projects . Every year, an overwhelming amount of time by system and network admins is spent in managing and analyzing information coming from multiple sources of traditional server monitoring . By acquiring an overarching server monitoring solution, companies can save tens thousands of dollars by streamlining and correlating the alerts coming from all over your IT infrastructure.

Depending on the software, you’ll want to check on which brand operating systems, web servers, app servers and database servers the server monitoring software you are considering is compatible with. Many have very intuitive and well thought out user interfaces that are easy to navigate and contain features such as graphics, alerting and very high-level monitoring functions. Many of the software out there will also offer an extensive set of plug-ins that allow their users to gather total performance metrics and availability of their company/personal data at all times.

When looking at the plethora of server monitoring software options available on the market today, you’ll want to make sure they include a few key and crucial features. One of the most important features you will want to look for is an interface that is intuitive and easy to use. Another key feature to look for, which most software offer, is a notification system that includes email and SMS for easy detection of problems as soon as they occur. As with any software you purchase, the easier the installation process typically the better as add-ons and updates will commonly occur as you use the product throughout its lifetime. By far the number one issue to address is how fast the software is, which will ultimately lead to how well it will perform during the lifetime of the software’s use.

Cloud based monitoring has often been argued to be more reliable and secure than traditional server monitoring. Some of the top reasons include secure remote accessing, network use monitoring, password management and administrative access from anywhere. As with the more traditional server monitoring software, online cloud based server monitoring software is available and depending on your needs, could be an arguably better fit.

In summary, below are just a few considerations you’ll want to consider when making your server monitoring software purchase. Among the most important is always going to be an easy to use interface that allows a single comprehensive view of all the issues and one that you can familiarize yourself with easily. Cloud based accessing can also be a major pro as it is often thought to be more reliable as you are using a third party source to back up all the data and information needed. The ability to late add add-ons is also a feature that is important to most people in the industry.

RightITnow ECM is a Web 2.0 Manager of Managers (MoM) solution providing multi-source event correlation software, optimizing IT Operations processes and supporting predictable SLA-based services.RightITnow ECM dramatically simplifies the management of IT operations by:- – Streamlining the volume of IT events coming from multiple sources such as Solarwinds, MS SCOM 2012, Nagios, VMware, Syslog, SNMP Traps and more,build your own event Connector using our SOAP API, Displaying Operational and Historical Dashboards with a comprehensive view of your Data center Health and your staff workload, Providing Extensive workflow options to match your IT business practices and Bridging the gap between IT operations and the service helpdesk offering tight integration with ServiceNow®, Zendesk, BMC Remedy, JIRA, Salesforce Service Cloud, ManageEngine

Using Event Correlation to Automatically Set Priority on VMware Low Disk Space Alerts

Using Event Correlation to Automatically Set Priority on VMware Low Disk Space Alerts

Raising the Visibility of VMware Low Disk Space with Event Correlation

Part of your IT operations involves using VMware’s vSphere for your virtualization projects. This week, you’ve been deploying scores of virtual systems for a new site, but you will soon be running into trouble because of disk space issues on the VMware side. Wouldn’t it be nice if you could create a rule that would automatically change to “WARNING” the severity of VMware disk space alerts so your operators would take notice? You can with the RightITnow ECM VMware connector and correlation rules!

Get Connected with the VMware Connector

RightITnow ECM comes with connectors to many third-party systems, including VMware. You can start collecting events from VMware within a matter of minutes by completing the simple configuration fields in ECM’s user interface.

Find the Right VMware Alerts

Now that you have VMware alerts flowing into ECM, you can use the Correlation Rule Builder to construct a rule that finds alerts whose events descriptions contain the words, “VMware vSphere Update Manager is critically low on storage space.” You can also check for related alerts exist that mention a specific VMware entity or parent entity.

Set the VMware Disk Space Alert Correlation Action

So, what do you want to do with all of these low VMware disk space alerts now that you have collected them? You want to make sure that they are assigned a severity of “WARNING” so your operators will jump in fast to add more storage volumes to your virtual environment. You can use the Correlation Rule Builder to trigger the Set to Warning action that would set the severity of any qualifying alert to “Warning” automatically. Now, that alert lights up in the color you’ve specified for WARNING on your alerts console.

Using Event Correlation to Automatically Raise Downed Server Alert Severity

Using Event Correlation to Automatically Raise Downed Server Alert Severity

Downed Web Server, but Operators Do Not Notice without Event Correlation

Your network operations center is super busy and your operators are too busy deploying hundreds of virtual systems for a new site to notice that a downed web server alert now has more than 200 associated events. That server has been down for quite a while and it would be nice to get it back up and running before your web-space clients start flooding your Zendesk with batches of associated tickets! Wouldn’t it be nice if you could write a rule that would automatically change the severity of that downed server alert to CRITICAL so your operators would take notice? You can with RightITnow ECM correlation rules!

Define the Downed Web Server Correlation Rule Conditions

Using the RightITnow ECM Correlation Rule Builder, you can instruct the RightITnow ECM correlation engine to match all events with a count greater than 10 whose description contains the words, “Web Server Down.” Once you have collected these events, you can act on the resultant alert.

Set the Downed Web Server Alert Correlation Action

So, what do you want to do with all of these downed web server events? You want to make sure that the resultant alert is assigned a very high severity so your operators will jump in fast to resolve the issue. You can use the Correlation Rule Builder to trigger the Set to Critical action that would set the severity of any qualifying alert to critical, automatically. Now, that alert lights up in bold red on your alert console, crying out for some operator attention and intervention.

As Long as We Have Focus on this Event, Let’s Do More!

You have built a correlation rule that automatically and reliably collects downed server events into an associated downed server alert and sets the priority to CRITIAL. As long as you have focus on this alert, you can do more with the correlation rule than just raise the severity to CRITICAL. You can use the RightITnow ECM Correlation Rule Builder to check if related following alerts exist, for example, is my mail server also down? You can also instruct the rule to perform an action if the condition is NOT true. For example, if you are getting downed server events, but not more than 10, you can trigger the Set to Medium Priority rule to set the alert severity to medium instead of CRITICAL.
Custom Alert Fields

Managing IT Ops Alerts with Custom Alert Fields

Creating Custom Alert Fields

You can create custom alert fields that appear on the Alerts Console as column headings, allowing you to add useful information categories to your alerts. You can create 20 custom fields, and 10 of those custom fields may be indexed. Queries on indexed custom fields run faster. Indexed custom fields have a maximum length of 254 characters. You may change an existing custom field from indexed to non-indexed and vice versa without losing the data it currently has.

Importing Incident Fields as Custom Alert Fields

You can map incident fields into RightITnow as custom alert fields, allowing you to present information from your third-party incident system on the single pane of glass Alerts Console. The only fields that can be imported from incident systems are the ones that can only take values from a list. Free text fields cannot be imported. The created custom fields share the same name as the field in the incident system and are of type List. If the field is dependent from another field in the incident system, both fields are imported and the relationship is preserved. Should the values from the custom list fields you have already imported change in the external system, you can refresh the values within RightITnow ECM by clicking Refresh imported fields.

Custom Alert Field Update Behavior

When updating an alert’s custom alert list field that has dependent custom fields, ECM clears dependent custom field values. If an action that updates a custom field with value “A” is fired against an alert that has already value “A” on that custom field, then the alert and database will not be updated and no workflow action executed. When deleting a custom field, ECM will prompt you whether it should clear the existing values of that custom field in the database.

Executing Actions Upon Custom Field Update

You can configure the workflow engine to execute an action or an action group after a custom field has been updated. This can be very helpful for automating tasks depending upon how custom field values change. For example, if the value “cost center” custom field updates from “United States” to “UK,” then you could trigger an email to your Accounting department apprising them of the change in cost center.

Rolling Up Alerts

Managing and Organizing High Alert Volume Using Rollup

Rolling up Alerts to Decrease Alerts Console Clutter

Sometimes, the best thing for an IT Ops operator is to simplify the alerts information flowing across the console. By selecting a lead alert and then selecting the alerts to roll up into that lead alert, you can significantly reduce the amount of repetitive alerts on the Console. For example, you may have an operator in charge of addressing all the disk full alerts. Instead of forcing the operator to search for each disk full alert, you can roll all of them up into a lead disk full alert so the operator can find all of them at once.

Rolling up Alerts to Connect Events

You may have an IT Ops issue that is creating lots of dissimilar alerts, and you may want to roll them up into one lead alert for an operator so that operator can see the impact of the IT Ops issue just by accessing the lead alert and drilling down into the alerts rolled up under that lead alert. For example, if you have a disk down and that disk stores print spool and email data, you will see disk down, print spooler, and email alerts flowing across your alerts console. You can roll up those print spooler and email alerts into the disk down alert and point your operator at it so your operator has all the information needed to address the leading and all downstream issues lighting up your console.

Configuring Alert Rollup for Your Environment

Rolling up alerts comes with lots of related features that let you customize the functionality to the needs of your specific environment. You can configure the feature to close rolled up alerts when lead alert is closed, include rolled up alerts in reports and exports, and automatically group alerts on roll up.

Finding those Nested and Lead Alerts

Only the lead alert appears in the Alerts console, but the rolled up alerts do not. You can expand the lead alert to see the alerts that you rolled up into it. When filtering the console, the lead alerts are returned but any rolled up alerts are not. However, you can include a condition in the Filter Builder that searches lead or rolled up alerts by using the Has Nested Alerts and Lead Alert ID conditions. This way, you get the power of rolling up alerts with the ability to find the individual lead and rolled-up alerts.

Achieving Two-Way Integration Between an IT Ops Event Correlation Manager and Incident Systems

Achieving Two-Way Integration Between an IT Ops Event Correlation Manager and Incident Systems

Two-Way Incident System Integration: It All Starts with Connectors

RightITnow ECM provides incident system connectors that allow direct integration and interoperability with ATLASSIAN JIRA, ManageEngine ServiceDesk Plus, BMC Service Desk (ARS 7.5), and Salesforce Service Cloud. ECM also provides a connector to the IT Service Management component of Serena’s Serena Business Manager (SBM). The connector creates an incident based on a RightITnow ECM alert and reflects the changes made on the incident to the alert. Additional incident management connectors include ServiceNow® and Zendesk.

Automatically Creating Incident Tickets Pre-Populated with Alert Info

ECM’s Create Incident action and associated Insert Incident menu item automatically create a third-party incident ticket in an Incident Management system such as ServiceNow®, and this incident is pre-populated with the alert info from which you inserted the incident. For example, imagine that you are reviewing an alert in ECM’s Alert Console and you spot one for which you would like to create a ServiceNow® incident ticket. All you need to do is right-click the alert and select the Insert Incident command to create a corresponding incident within ServiceNow® that contains all relevant alert information from ECM. Similarly, you can use the Update Incident command to update the incident ID attached to an alert with an existing incident ID, and even automatically execute an action after the update. You can choose to append or overwrite the info in the incident system.

Updating ECM Alert Custom Fields with Incident System Info

You can create custom alert fields in ECM that correspond to fields in external incident systems. For example, you could create a custom alert field, incidentStatus that corresponds to the ServiceNow® incident status field, and then using the Update Alert Custom Field action, you can update the status of the ServiceNow® incident as displayed in the ECM Alert’s custom field, yielding two-way integration between ECM and the third-party incident system.

Acting On Underlying Alerts Using Incident Creation Workflow Rules

ECM provides sophisticated workflow rules you can use to configure ECM to take action on alerts when creating an incident in a third-party incident management system from within ECM. Incident creation workflow rules include automatically assigning alerts to the logged in user when creating an incident based on the alert, and running an action or actions after creating an incident or updating an alert with an incident. You can also configure the workflow to take specific actions whenever incident value status changes.

Integrating an IT Ops Event Correlation Manager with Third-Party Apps and Tools

Integrating an IT Ops Event Correlation Manager with Third-Party Apps and Tools

Event, Alert, Entity and Maintenance Management with the ECM REST API

You can use the ECM REST API to harness all of the power of ECM within your own IT Ops management app. You can use the ECM REST API to manage and manipulate events, alerts, entities, and entity maintenance. Event and Alert functionality includes getting alerts, filters and breached SLAs; getting a list of events that have occurred between a specified time interval; changing alert priority, alert severity and alert ownership; unassigning, acknowledging, annotating, invoke an action on, and closing alerts; and creating incidents for specified alerts. Entity maintenance functionality includes getting, setting, and removing maintenance windows. Entity management features include creating, reading, updating and deleting entities in a multitude of ways and focuses. See the IT Operations REST API post at http://www.rightitnow.com/operations-management/it-operations-rest-api/ for complete details.

Publishing ECM RSS Feeds to Third-Party Applications

The paged alert filters that you create and save from the Alerts Console are available as RSS feeds. Access the feed by clicking the RSS icon in the alerts console filter pane. RightITnow ECM returns feeds in RSS 2.0 format. You can control the look of the RSS Feeds by configuring the RSS feed template. The feed’s channel elements are derived from the filter’s specifications and each item in the feed represents an alert.

Publishing Alerts to Third-Party Applications

The ECM Alert Publisher connector allows you to export alerts to an external JMS queue or topic, so that these alerts can be processed by your external system. You need to setup the queue or topic, and ECM will publish alerts to it. You can configure publishing to occur automatically whenever an alert is created or any of its fields updated. You can also define a filter so that only alerts that match the filter are published. Apart from auto-publishing of alerts, an ECM action can be used to manually trigger publishing of alerts from the alerts console or through correlation rules and the alert workflow. Alerts are published as a JSON formatted string and include all the alert fields that are available in the ECM user interface, as well as some additional fields used internally by ECM. Only one Alert Publisher connector can run at a time.

IT Ops Data Crunching via CSV

Aside from ECM’s more sophisticated integration points, including built-in and custom connectors, RSS feeds, and the ECM REST API; ECM can export audit log, entity, and alerts data to good old reliable CSV (Comma Separated Values) files that you can import into any of your analytics, reporting, spreadsheet, or other applications that import CSV files. This affords you direct access to the raw, pure data within ECM for analysis and manipulation in your favorite and most familiar applications.

IT Ops Integration and Interoperability via Event Connectors

Solarwinds API from RightITnow

Achieving IT Ops integration and Interoperability with Event Connectors

Native Event Connectors that Bring It all To a Single Pane of Glass

You can use ECM’s built-in, easily configurable event connectors to collect and act on events from many external sources. For example, ECM can collect events from Amazon Web Services (AWS) CloudWatch and can poll AWS every minute for changes to alarm states and raise an event in RightITnow ECM when it encounters one. You can run a separate CloudWatch connector for every AWS region you want to monitor. The region is configurable in the settings pane by selecting the appropriate endpoint. You can also collect and process events from InfoVista, JDBC, ManageEngine Applications Manager, Microsoft SCOM 2007 R2 and 2012, Nagios, and SolarWinds Orion NPM (Network Performance Monitor) and SAM (SolarWinds Server & Application Monitor). The SolarWinds connector discovers component names when polling, but ECM enriches a component only when it encounters an alert related to that component. Additional event connectors include VMware, and Zenoss.

Collect Right from the Source with SNMP Traps and Syslog Connectors

Sometimes, you want to collect events directly from network devices, such as servers, printers, hubs, switches, and routers, rather than collecting them third-hand from an intermediary application. ECM’s SNMP Trap connector allows you to do just that, collecting events directly from all your entities in their purest form for processing by ECM. And what about logs? Logs are an IT operator’s vital roadmap to resolving IT Ops issues, and ECM’s Syslog connector ensures that the logs you collect are most useful by collecting logs that enable separation of the generating software, the storing system, and the analyzing software.

Roll Your Own Event Connector with Our Event SDK

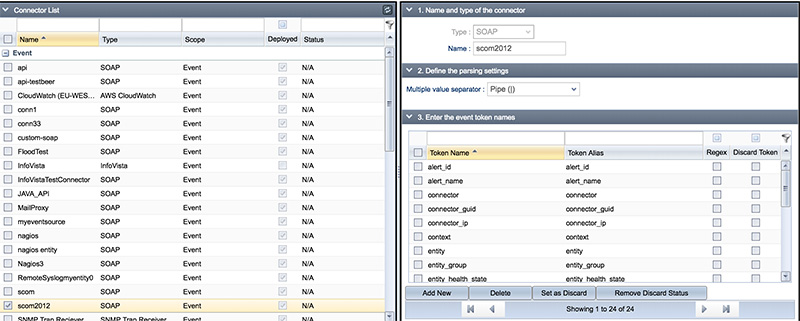
You can use ECM built-in event connectors out of the box, or you can create your own custom event connector using ECM’s Event SDK. The ECM Event SDK is comprised of a number of individual APIs for Java and Python, and a more generalized SOAP API. In RightITnow ECM, an event is the most basic object of meaning and can be used to create alerts or trigger actions in the system. Events allow extensive control over RightITnow ECM. You can use the ECM SOAP interface to send events. This interface provides a fairly quick and easy method of forwarding events from other systems. When expected volumes of events are high or enterprise features are needed, such as failover support, consider using the Java API with the ActiveMQ connector.

De-duplicating and Processing All of These Events

So, you have collected all of these events from disparate systems into ECM. Now what? Let ECM do its magic by de-duplicating the events into existing alerts and then correlating the events with actions that can resolve IT Ops issues before you ever see them on your Alerts Console.

Back To TopBack To Top
