The ECM Platform

Every monitoring tool you run.
One console that makes sense of it.

RightITnow ECM (Event Correlation Manager) sits above SolarWinds, Nagios, Zabbix, Zenoss, Dynatrace, Datadog, Amazon AWS, Microsoft Azure, and 50+ other sources. It correlates raw events into root-cause incidents, maps how your infrastructure depends on itself, and gives your NOC, your managers, and your CIO a view they can actually use.

50+
Native monitoring & ITSM connectors
95%
Typical reduction in alert noise
Faster mean time to resolve
On-prem
or cloud
Deploy however your team works
Collects from
Nagios SolarWinds Zabbix Zenoss Dynatrace Datadog Amazon AWS Microsoft Azure Google Cloud ServiceNow Splunk + more
Inside the console

A NOC console built around incidents, not noise

Four views your team will live in every day — each one drawn from the same correlated event stream, updated in real time.

Correlation engine

Thousands of alerts. A handful of incidents.

ECM ingests raw events from every connected tool and applies your correlation rules to group related alerts automatically — by entity, by tag, by time window, or by custom logic you define. Your team works the incidents, not the firehose.

  • Deduplication and suppression rules, configured visually — no scripting
  • Automatic grouping by entity, tag, owner, or time window
  • Drill into any group to see every underlying raw event
  • Full-text search, saved filters, and one-click ungrouping
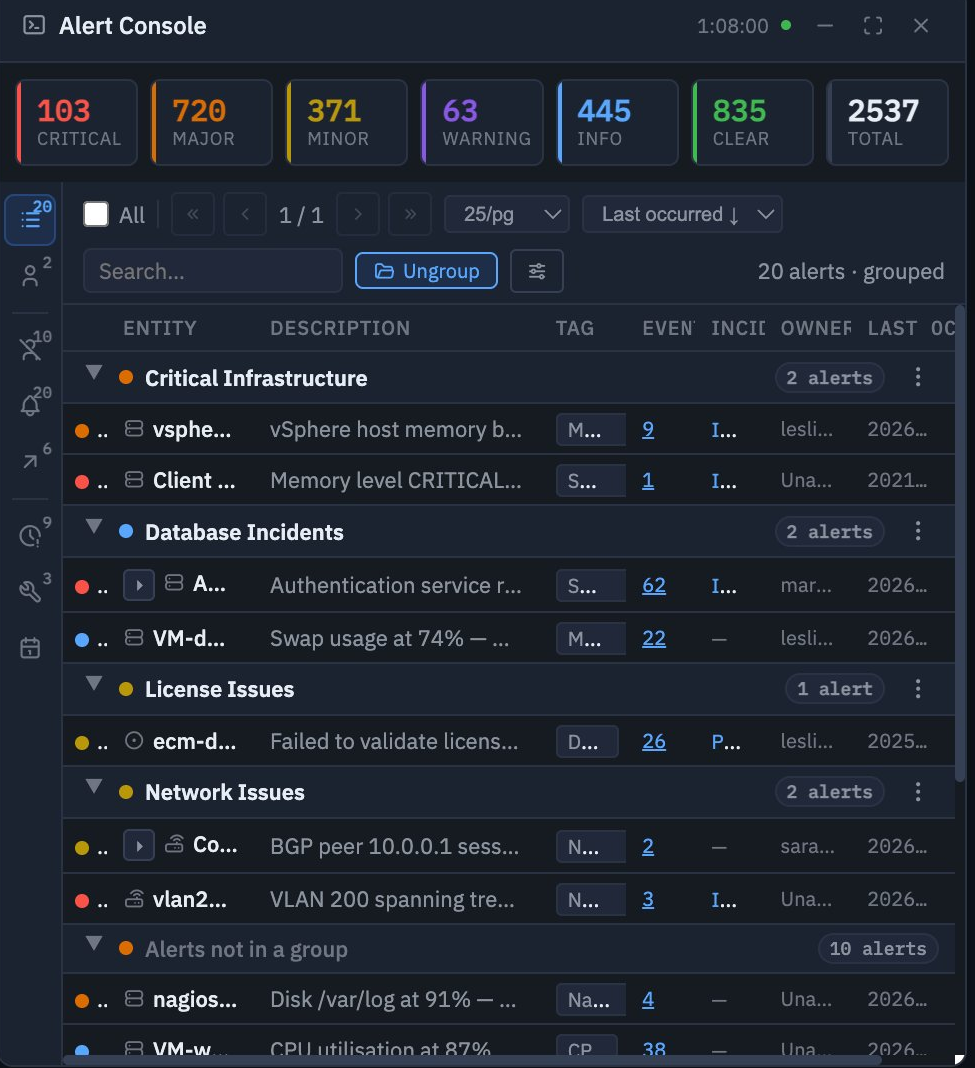
ECM Alert Console showing alerts grouped into Critical Infrastructure, Database Incidents, License Issues, and Network Issues
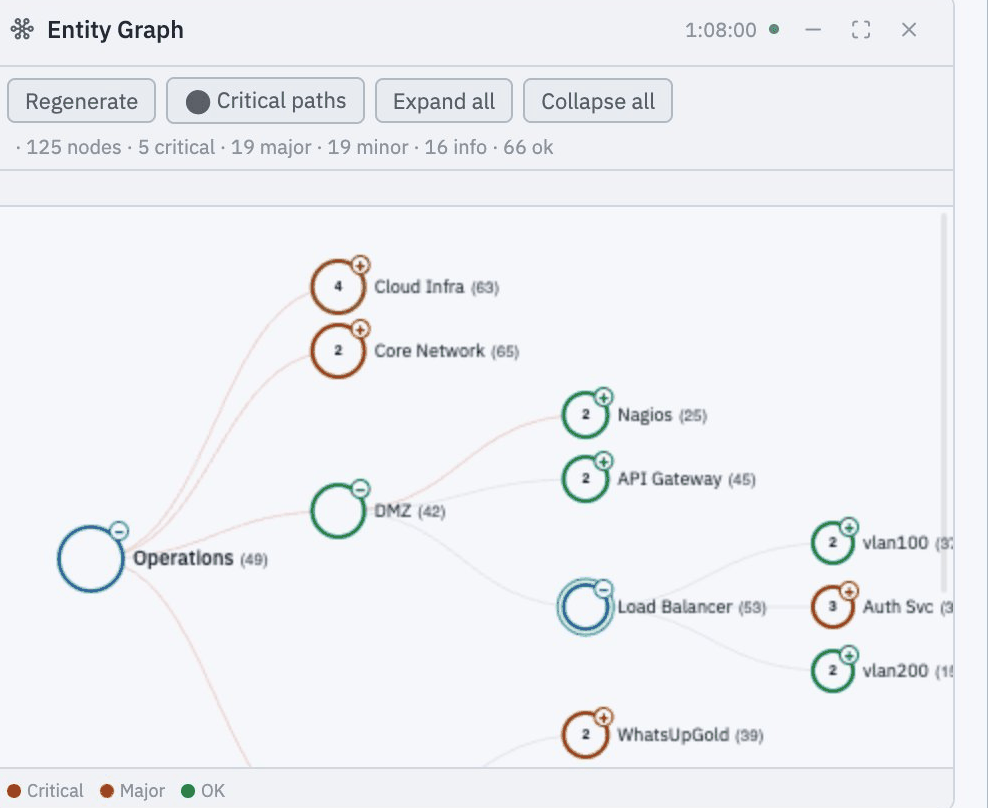
ECM Entity Graph showing a topology map with critical paths highlighted from Operations through Load Balancer to Auth Svc
Topology & root cause

See how your infrastructure connects — and where it breaks first

ECM builds a live dependency graph from your discovered topology and CMDB. When something fails, critical-path highlighting shows the blast radius instantly, so your team fixes the cause instead of chasing twenty downstream symptoms.

  • Auto-discovered topology across 50+ connected tools
  • Critical-path highlighting shows upstream cause and downstream impact
  • Expand or collapse any branch to drill into a domain
  • Click any node to jump straight to its alerts
Analytics & capacity planning

Spot the trend before it's an incident

Every alert ECM correlates is also a data point. Historical Trends tracks alert volume per entity group over 7 days, 30 days, 90 days, or a year — so chronic issues and slow capacity creep show up long before they page someone at 3am.

  • Per-group volume trends with min, average, max, and latest
  • Switchable 7d / 30d / 90d / 1y windows
  • Feeds SLA dashboards for managers and executives
  • Export via REST API to your BI or reporting stack
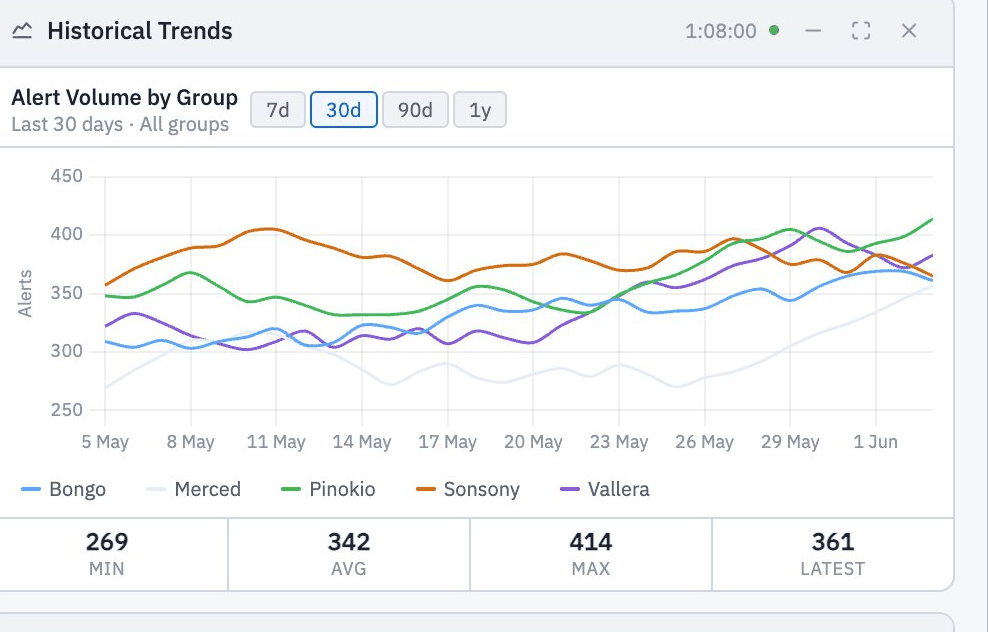
ECM Historical Trends chart showing alert volume by group over the last 30 days, with min, average, max, and latest figures
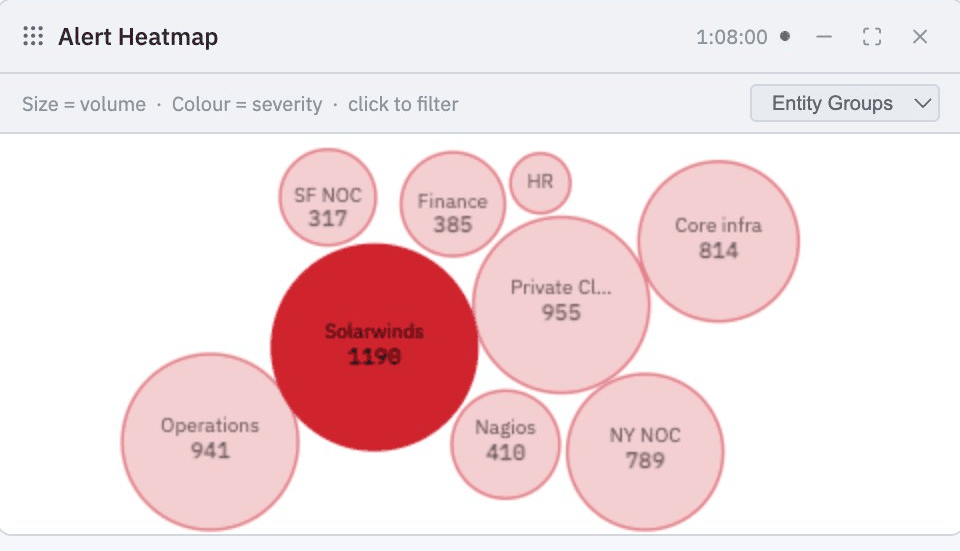
ECM Alert Heatmap showing entity groups as bubbles sized by alert volume and coloured by severity, with Solarwinds the largest and most critical
At-a-glance visibility

Find your noisiest systems in seconds

The Alert Heatmap sizes every entity group by alert volume and colours it by severity, so the worst offenders are visually obvious the moment the dashboard loads. Click any bubble to filter the Alert Console to exactly that group.

  • Bubble size = alert volume, colour = severity
  • Click any bubble to filter the console instantly
  • Group by entity group, tag, or owner
  • Updates in real time as new events arrive
Beyond the dashboard

Everything else ECM does for your team

Correlation and visibility are the foundation. These are the capabilities that close the loop.

Automation workflows

Trigger remediation scripts, acknowledgements, or escalations the moment an incident is created or cleared — no manual intervention needed.

Bidirectional ITSM integration

ECM creates, routes, acknowledges, and closes tickets in ServiceNow (including Utah), Jira Software 9.x and Jira Software Cloud, and BMC automatically — and stays in sync when the ticket changes.

💬

AI Incident Narrator

Plain-language incident summaries generated automatically, tailored to three audiences: NOC operator, IT manager, and CIO.

📱

Mobile alerts

The ECM iOS app keeps on-call engineers informed and lets them acknowledge, escalate, or resolve incidents from anywhere.

🛠

Maintenance windows

Schedule one-off or recurring maintenance windows that automatically suppress expected alerts — no more 2am false pages during patch cycles.

Open API & 50+ connectors

Pre-built connectors for every major monitoring, cloud, and ITSM tool, plus a full REST API for anything custom.

Multi-cloud node deployment

Deploy dedicated nodes to process alerts across Microsoft Azure, Amazon AWS, and Google Cloud alongside your existing on-premises data centers — all from a single pane of glass. ECM's own health and system metrics are available as Grafana/Prometheus data sources.

📊

ML-powered anomaly detection

Export alerts to Elasticsearch Cloud for real-time anomaly detection, track shifts in alert severity and priority over time, and break down alerts by source for faster root cause analysis.

🌐

Multilingual Alert Console

The Alert Console is available in English, French, and Japanese, with an extensible framework for adding more languages as your team grows.

Customer outcomes

What teams say after deploying ECM

Real results from organisations using RightITnow ECM as their correlation and NOC layer.

"We deployed a central event processing console against our existing legacy systems in record time. RightITnow provided a simple, cost-effective licensing model."
— Enterprise IT Operations Team
"Our NOC now only watches ECM, which has improved response times. We've unified our workflow across technology areas, which reduced administrative overhead."
— Global Infrastructure Operations
"Chronic issues that had been long masked became obvious within days, allowing us to dramatically cut down our event volume — before we'd even trained our team."
— IT Operations Director, Financial Services

Ready to see your own alerts in ECM?

Free for up to 100 managed entities. No credit card needed. Cloud or on-prem, up and running in minutes.