How it works

From raw events to resolved incidents — in four steps.

ECM sits between your monitoring tools and your team. It collects every event, correlates it with everything else happening across your infrastructure, shows your team exactly what matters, and can act on it automatically — all without replacing a single tool you already run.

1. Your tools SolarWinds, Nagios, Zabbix, Zenoss, Dynatrace, Datadog, cloud platforms, ServiceNow… 2. Collect 50+ pre-built connectors collect and normalise events in real time 3. Correlate Dedup, suppression, and topology-aware grouping — your rules, configured visually 4. Visualise & act Alert Console, Entity Graph, automation, ITSM sync, mobile & AI summaries
The pipeline

Four stages, one continuous flow

Every event that reaches your team has already passed through all four stages — automatically, in real time.

Collect

Connectors poll, subscribe to, or receive webhooks from every monitoring and ITSM tool you run, and normalise events into a common format.

Correlate

Deduplication, suppression, and grouping rules — aware of your topology — turn thousands of raw events into a handful of incidents.

Visualise

The Alert Console, Entity Graph, Historical Trends, and Alert Heatmap give every audience the view they need.

Act

Automation workflows, bidirectional ITSM sync, mobile alerts, and AI-generated summaries close the loop without manual work.

In detail

What happens at each stage

A closer look at how events move through ECM from the moment they're generated.

Step 1 — Collect

No agents to deploy, no formats to wrangle

Each of ECM's 50+ connectors knows how to talk to its source natively — polling SNMP traps from Nagios, subscribing to SolarWinds' alert stream, reading CloudWatch events, or receiving webhooks from ServiceNow. Every event is normalised into a common schema the moment it arrives, so the correlation engine works from a consistent view regardless of where an event came from.

  • Pre-built connectors for SolarWinds, Nagios, Zabbix, Zenoss, Dynatrace, Datadog, ServiceNow, and more
  • Polling, streaming, and webhook ingestion — whatever the source supports
  • Automatic field normalisation across tools (severity, entity, timestamp, tags)
  • A REST API for anything custom or homegrown
Nagios SolarWinds Zabbix Dynatrace Datadog Zenoss ServiceNow Splunk SCOM VMware AWS · Azure · GCP REST API + more
Dedup

Same alert, same entity, repeated within 5 minutes → keep one, increment the counter.

Suppress

Downstream alerts during a known upstream outage → suppress until the parent clears.

Group

All alerts tagged "Database Incidents" within a 10-minute window → one incident, multiple events.

Maintenance

Alerts from entities inside an active maintenance window → suppressed automatically.

Step 2 — Correlate

Rules you configure visually — not a scripting language

This is where the noise reduction happens. ECM applies your correlation rules — deduplication, suppression, grouping, and maintenance-window awareness — to the normalised event stream. Rules are built in a visual editor and can reference entity relationships from the topology graph, so a switch outage doesn't generate forty separate "downstream unreachable" incidents.

  • Visual rule builder — no proprietary scripting language
  • Topology-aware: correlate based on real dependencies, not just tags
  • Rules can be tested against historical events before going live
  • Typical result: 95% fewer alerts reach the console
Step 3 — Visualise

One console, four views, every audience

Correlated incidents land in the Alert Console, grouped and searchable. From there, the Entity Graph shows how the affected systems relate to everything else, Historical Trends shows whether this is a one-off or a pattern, and the Alert Heatmap shows where to look first across your whole estate. Same data, four ways to look at it.

  • Alert Console — grouped, searchable, filterable incidents, available in English, French, and Japanese
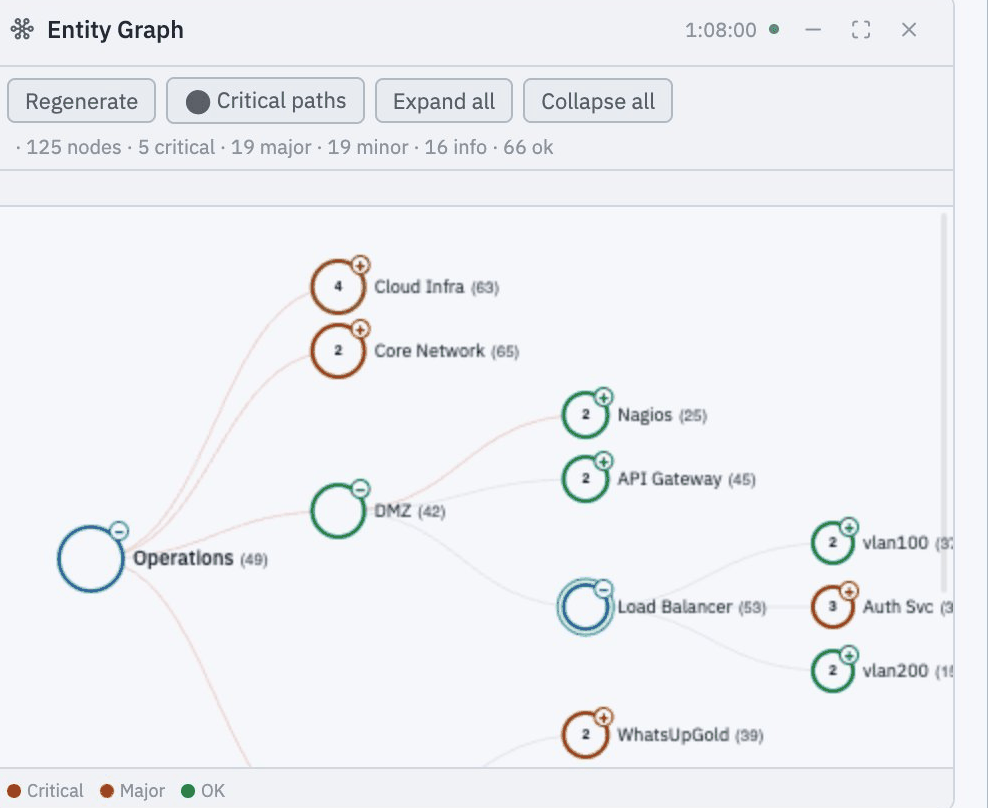
  • Entity Graph — live topology with critical-path highlighting
  • Historical Trends — volume by group over 7d / 30d / 90d / 1y
  • Alert Heatmap — volume and severity at a glance, click to filter
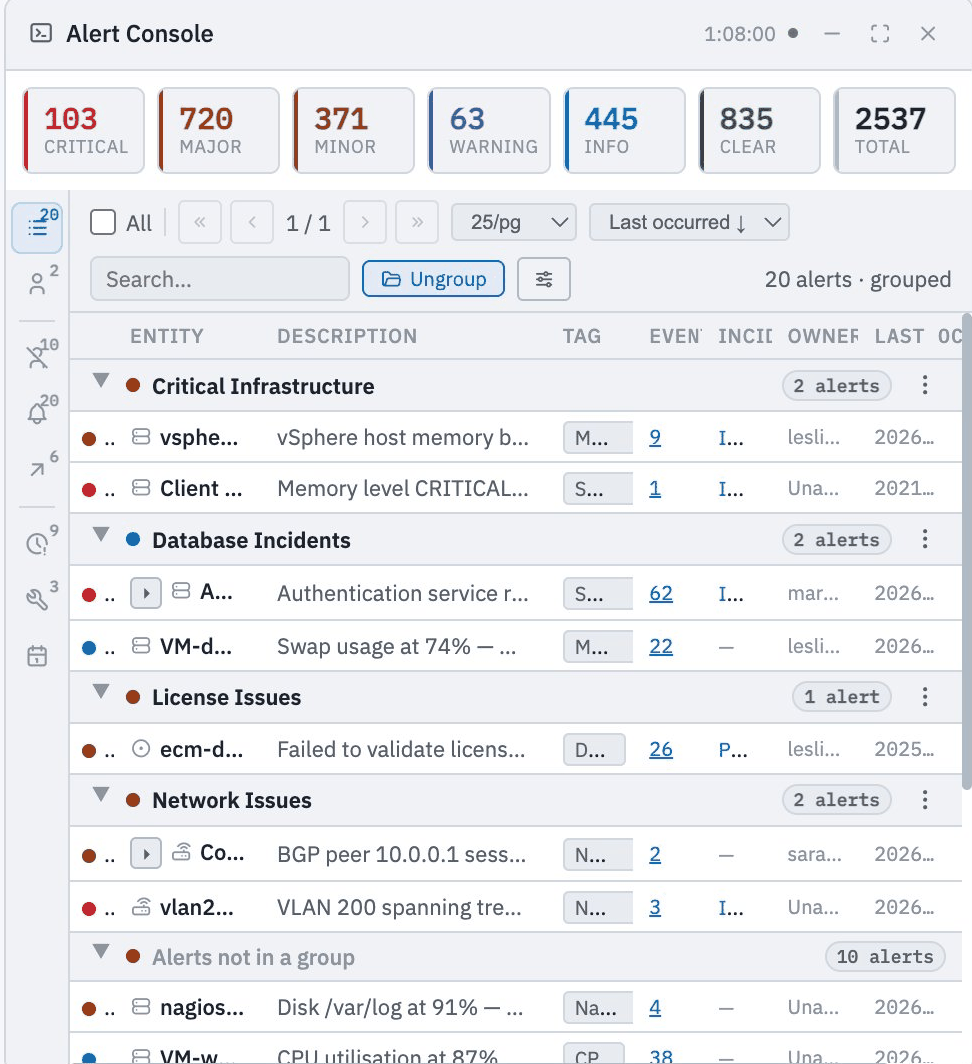
ECM Alert Console showing alerts grouped into Critical Infrastructure, Database Incidents, License Issues, and Network Issues
ECM Entity Graph showing a topology map with critical paths highlighted from Operations through Load Balancer to Auth Svc
Step 4 — Act

The loop closes without anyone copying and pasting

An incident doesn't just sit in a console waiting for someone to notice. ECM can open, route, acknowledge, and close tickets in ServiceNow, Jira, or BMC automatically as the underlying alerts change. Automation workflows can trigger remediation scripts directly. On-call engineers get pushed to their phones. And the AI Incident Narrator turns the raw correlation into a plain-language summary for whoever's reading it.

  • Bidirectional ITSM sync with ServiceNow (including Utah), Jira Software 9.x/Cloud, and BMC — tickets stay in step with incident state
  • Automation workflows trigger remediation on incident creation or clearance
  • Mobile alerts let on-call engineers act from anywhere
  • AI Incident Narrator: one incident, three summaries — NOC, manager, CIO
Getting started

Cloud or on-prem — same platform, your choice

Both deployment options run the same correlation engine and connectors. Pick based on where your data needs to live.

Cloud

Up and running the same day

Sign up, point ECM's connectors at your monitoring tools, and alerts start flowing within minutes. No infrastructure to provision or patch. Best for teams who want to be correlating events today.

On-prem

For data that can't leave your network

Run ECM inside your own infrastructure when alert data, topology, or compliance requirements mean it can't go to the cloud. Same connectors, same correlation engine, same console — deployed where you control it.

Hybrid estate? Deploy dedicated ECM nodes across Microsoft Azure, Amazon AWS, and Google Cloud alongside your on-prem data centers — all correlated in the same single pane of glass.

Questions

Common questions about getting started

If you don't see your question here, ask us directly — we typically reply within a day.

How long does deployment actually take?

For cloud, most teams have their first connector live and alerts flowing within hours of signing up. On-prem typically takes a day for initial installation and connector setup, then iterative tuning of correlation rules over the following days as you see real traffic.

Will ECM replace our existing monitoring tools?

No. ECM sits above SolarWinds, Nagios, Zabbix, Zenoss, Dynatrace, Datadog, and 50+ other tools via native connectors. Your team keeps using the tools they know for monitoring — ECM is where the correlated, cross-tool view lives.

Can we bring our existing correlation or dedup logic with us?

Yes. During onboarding, we help map existing suppression and deduplication logic — whether that's rules in another tool or scripts your team maintains — into ECM's visual rule builder, so you're not starting from zero.

Where does our alert and topology data live?

Your choice. Cloud deployments run in managed regions with standard data protection practices; on-prem deployments keep all data inside your own infrastructure. Both run the same platform.

Do we need to write code or learn a scripting language?

No. Correlation rules, dashboards, and automation workflows are all configured visually. A REST API is available if your team wants to build custom integrations on top.

What happens after the free 100-entity tier?

You can keep growing on transparent, predictable pricing — no per-event licensing surprises, since your event volume typically drops as correlation kicks in. Talk to us for a quote based on your entity count.

Does ECM support anomaly detection or multiple languages?

Yes. ECM 6.4 added an Elasticsearch Cloud export for real-time anomaly detection — tracking shifts in alert severity and priority and breaking down alerts by source — plus a multilingual Alert Console available in English, French, and Japanese, with more languages planned.

See your own events move through ECM

Free for up to 100 managed entities. No credit card needed. Cloud or on-prem, up and running in minutes.